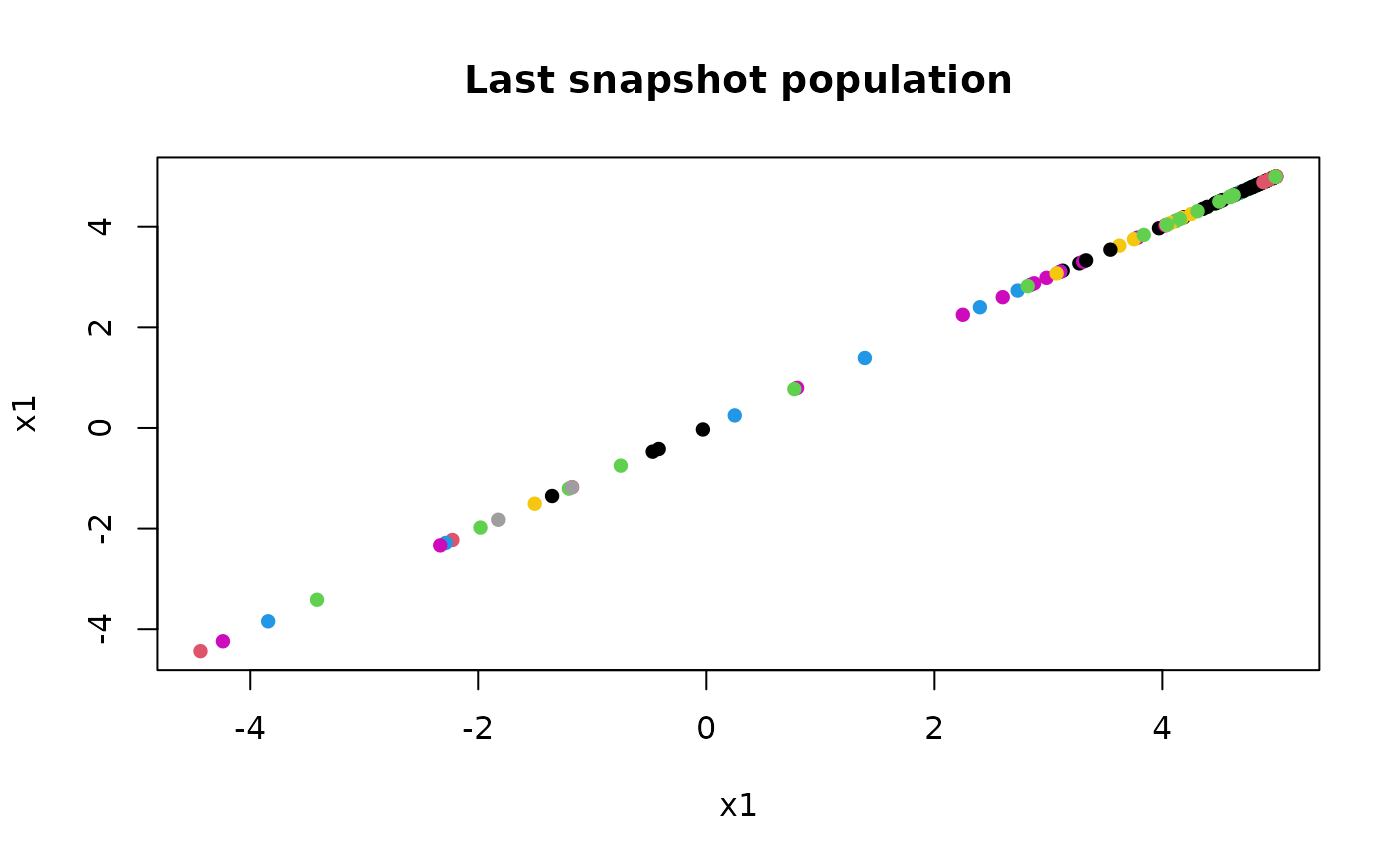
plotPopulation method for "hms" class.
Examples
f <- function(x) x
result <- hms(fitness = f, lower = -5, upper = 5)
#> A list of standard deviations (sigma) or a function to create population should be provided.
#> Metaepoch: 0 Best fitness: 4.985645
#> Metaepoch: 1 Best fitness: 4.985645
#> Metaepoch: 2 Best fitness: 4.997962
#> Metaepoch: 3 Best fitness: 4.997962
#> Metaepoch: 4 Best fitness: 4.997962
#> Metaepoch: 5 Best fitness: 4.997962
#> Metaepoch: 6 Best fitness: 4.997962
#> Metaepoch: 7 Best fitness: 4.997962
#> Metaepoch: 8 Best fitness: 4.999447
#> Metaepoch: 9 Best fitness: 4.999447
plotPopulation(result, c(1, 1))
