The HMS (Hierarchic Memetic Strategy) is a composite global optimization strategy consisting of a multi-population evolutionary strategy and some auxiliary methods. The HMS makes use of a dynamically-evolving data structure that provides an organization among the component populations. It is a tree with a fixed maximal height and variable internal node degree. Each component population is governed by a particular evolutionary engine. This package provides a simple R implementation with examples of using different genetic algorithms as the population engines.
Relevant literature
- J. Sawicki, M. Łoś, M. Smołka, R. Schaefer. Understanding measure-driven algorithms solving irreversibly ill-conditioned problems. Natural Computing 21:289-315, 2022. doi: 10.1007/s11047-020-09836-w
This package does not provide an implementation of a Simple Genetic Algorithm to be used in demes. However the default configuration uses SGA implementation from GA package available on CRAN.
Installation
You can install the released version of hmsr from CRAN:
install.packages("hmsr")or the development version from this repository:
install.packages("devtools")
library("devtools")
devtools::install_github("WojtAcht/hms")
Usage
Default configuration
To run the HMS with a default configuration the only arguments that have to be provided are the bounds of the domain: lower and upper
Custom configuration
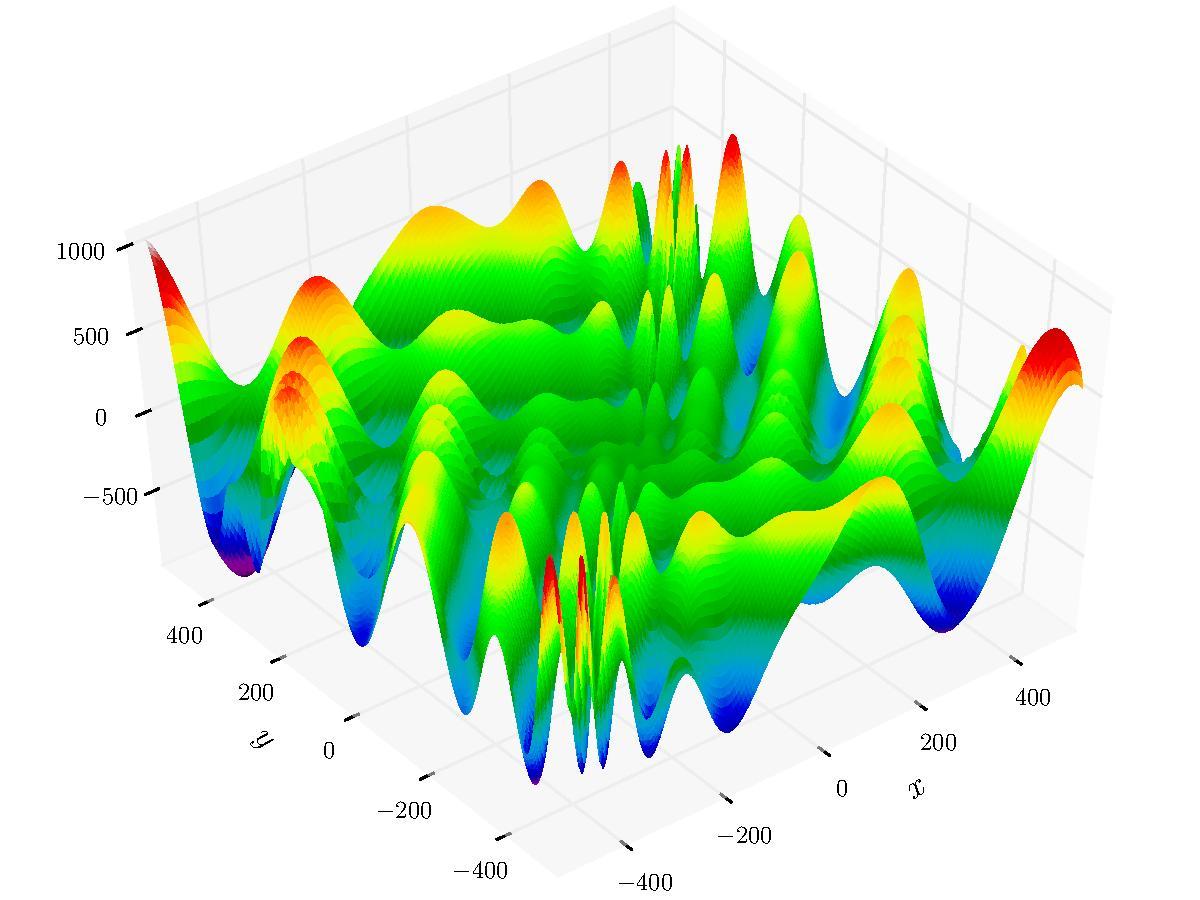
There are number of parameters used for strategy configuration. The sample below runs HMS on the Eggholder function - a benchmark for optimization problems.
library(smoof)
Eggholder <- smoof::makeEggholderFunction()
lower <- rep(-512, 2)
upper <- rep(512, 2)
sigma <- list(rep(200, 2), rep(100, 2), rep(50, 2))
ga_config <- list(
    list(
        pmutation = 0.4,
        mutation = rtnorm_mutation(lower, upper, sigma[[1]])
    ),
    list(
        pmutation = 0.2,
        mutation = rtnorm_mutation(lower, upper, sigma[[2]])
    ),
    list(
        pmutation = 0.2,
        mutation = rtnorm_mutation(lower, upper, sigma[[3]])
    )
)
HMS <- hms(
    fitness = Eggholder,
    minimize = TRUE,
    tree_height = 3,
    lower = lower,
    upper = upper,
    run_metaepoch = ga_metaepoch(ga_config),
    population_sizes = c(50, 30, 15),
    sigma = sigma,
    gsc = gsc_max_fitness_evaluations(20000),
    sc = sc_max_metric(euclidean_distance, c(40, 20, 10)),
    lsc = lsc_metaepochs_without_improvement(15),
    monitor_level = "none",
    with_gradient_method = TRUE
)
To see the structure of demes tree at the end of the evaluation, use printTree function
printTree(HMS)
#> f(476.52, 431.37) = 943.07 evaluations: 7675 A
#> ├-- spr: (507.90, 402.59); f(480.26, 430.74) = 956.02 evaluations: 1955 A
#> |   └-- spr: (507.49, 400.58); f(482.35, 432.88) = 956.92 evaluations: 879 A
#> ├-- spr: (479.43, 436.05); f(478.82, 429.39) = 954.55 evaluations: 2341 A
#> |   └-- spr: (480.59, 430.58); f(482.35, 432.88) = 956.92 evaluations: 1075 A
#> └-- spr: (365.96, 500.10); f(507.31, 401.35) = 938.19 evaluations: 4293 A
#>     └-- spr: (441.83, 454.04); ***f(512.00, 404.23) = 959.64*** evaluations: 2000 A
To display a plot showing how best solution has changed during the evaluation use plot(HMS).